Mathematics
Probability & The Safety Car: The Statistics of F1 Strategy
In the world of Formula 1, the difference between a podium finish and a mid-field result often boils down to decisions made in fractions of a second. While the raw speed of drivers like Max Verstappen or Lando Norris is vital, the "invisible" battle is fought on the pit wall by strategists using advanced mathematics. At the heart of this battle is the Safety Car (SC)— a variable that introduces high-stakes "Energy Chess" into the race. What looks like a chaotic interruption to fans is, for a strategist, a masterclass in Expected Value, Delta Timing, and Monte Carlo simulations.
1.0 The "Free" Pit Stop: The Math of the Delta
The most fundamental mathematical concept involving the Safety Car is the "Pit Lane Delta." This refers to the time lost by a car entering the pits relative to a car staying on the track.
Standard Racing Conditions: At full speed, a car might take 20 seconds to navigate the pit lane, while cars on track are traveling at 300+ km/h. The net time loss is usually between 20 and 25 seconds.
Safety Car/VSC Conditions: When the SC or Virtual Safety Car (VSC) is deployed, the cars on track are forced to slow down significantly (by roughly 40%). However, the speed limit in the pit lane remains constant.
The "Discount": Because the field on track is moving so much slower, the relative time lost during a pit stop is slashed to approximately 10 to 12 seconds.
The Strategic Gamble: Strategists view this as a "discounted" stop. If a team believes there is a high probability of an SC, they will intentionally extend a stint on worn tires. They are gambling that the 10-second "gift" from an SC stop will outweigh the few tenths of a second they lose per lap by driving on old rubber.
2.0 Expected Value: Making Decisions Under Uncertainty
Formula 1 teams do not use a single "fixed" plan; they use a dynamic model to calculate Expected Race Time (E). This is a weighted average of all possible race scenarios.
The mathematical formula for the expected value of a strategy is:
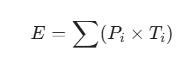
- Pi = The probability of a specific scenario (e.g., a Safety Car on lap 35).
- Ti = The total race time resulting from that scenario.
Strategists use historical data to assign these probabilities. For example, at the Singapore Grand Prix, the historical probability of a Safety Car is nearly 100%, whereas at Paul Ricard, it might be as low as 10%. These probabilities are then fed into the model to determine the "Optimal Pit Window." If the probability of an SC is high enough, the math will dictate a "late-stop" strategy even if it means sacrificing pure pace in the short term.
3.0 Monte Carlo Simulations: 10,000 Races Per Second
Because a Grand Prix involves 20 cars, changing weather, and varying tire degradation, the equations are too complex for a human to solve in real-time. Instead, teams use Monte Carlo simulations.
- Randomized Variables: A computer runs thousands of "virtual races" every few seconds. In one simulation, an SC happens on lap 10; in another, it never happens; in another, there is a sudden rain shower.
- Outcome Distributions: The strategy software doesn't give a single answer. It provides a Probability Distribution. It might tell the team: "There is a 70% chance of finishing P3 if we pit now, but if we wait for an SC, we have a 15% chance of P1 and a 15% chance of dropping to P6".
- Risk Appetite: The team principal then decides based on their "risk appetite." A team leading the championship (like Red Bull) might take the 70% "safe" option, while a team chasing a first podium (like McLaren) might take the high-risk gamble on the SC window.
4.0 The "Safety Car Window" and Strategic Toggling
Every team defines a "Safety Car Window" before the race starts. This is a specific range of laps where the team’s reaction is pre-determined.
- The "Must-Stop" Lap (M): The lap where the tires will physically fail or become too slow to continue.
- The "Safety Car Opening" (K): The earliest lap where an SC pit stop would allow the car to finish the race without needing another stop.
- Toggling: If an SC occurs between Lap K and Lap M, the team toggles to a pre-arranged "Plan B" and pits immediately. If it happens before Lap K, the math often says to stay out, as a second stop would be required later, negating the "discounted" time advantage.
5.0 Conclusion: The Logic of the Gamble
In F1, luck is just "probability meeting preparation." When we see a driver benefit from a perfectly timed Safety Car, it is rarely a coincidence. It is the result of a team that stayed out on old tires because their Monte Carlo simulations showed that the "Expected Value" of waiting for an SC was higher than the value of a standard stop.
The 2026 regulations will only increase the importance of this math. With the 50/50 hybrid power split, energy management will become another variable in the SC window. Teams will need to decide if they should harvest extra energy during the SC period to attack during the restart or save fuel for the final sprint. In the end, the winner of the race is often the one who played the best game of Statistical Chess.
6.0 Bibliography
Artem Filatov. (2022). F1 Strategy: Optimization, Probability, and Game Theory. [online] Medium. Available at: https://medium.com/@artemfilatov_62210/f1-strategy-optimization-probability-and-game-theory-3be82abb3654 [Accessed 13 Feb. 2026].
Aston Martin F1. (2024). Strategically speaking: F1 strategy explained with Tom McCullough. [online] Available at: https://www.astonmartinf1.com/en-GB/news/feature/strategically-speaking-f1-strategy-explained-with-tom-mccullough [Accessed 13 Feb. 2026].
Formula 1 Dictionary. (n.d.). Race Strategy. [online] Available at: https://www.formula1-dictionary.net/strategy_race.html [Accessed 13 Feb. 2026].
Raceteq. (2024). How Formula 1 teams determine the fastest race strategy. [online] Available at: https://www.raceteq.com/articles/2024/07/how-formula-1-teams-determine-the-fastest-race-strategy [Accessed 13 Feb. 2026].
SIG Machine Learning. (2025). Monte Carlo. Game Theory. Machine Learning. The Race Strategy Triangle for Formula 1. [online] Available at: https://www.sigmachinelearning.com/post/monte-carlo-game-theory-machine-learning-the-race-strategy-triangle-for-formula-1 [Accessed 13 Feb. 2026].
Test Your Knowledge!
Click the button below to generate an AI-powered quiz based on this article.
Did you enjoy this article?
Show your appreciation by giving it a like!
Conversation (0)
Cite This Article
Generating...